Executive Summary
China's exports of adjustable dumbbells to South America more than doubled between 2020 and 2026, but the growth was cyclical rather than linear. Shipments rose from 142,000 sets in 2020 to an estimated 265,000 sets in 2026, equal to a compound annual growth rate of 11.0% over the six years. Excluding the pandemic distortion, the pace since the 2023 trough is considerably faster, at 15.7% a year, and that is the rate that should inform capacity and tooling decisions for 2027.
Three findings carry the argument of this report. First, demand is now consumer-led rather than shock-led. The 2020–2021 wave was a one-off substitution effect created by closed gyms and lockdowns; the current expansion rests on home training habits that survived the reopening, on smaller urban dwellings that make a single space-saving unit more attractive than a rack of fixed dumbbells, and on cross-border platforms that shortened the route from a Chinese factory to a household in Bogotá or Santiago. Second, growth has shifted away from Brazil. Brazil still absorbs an estimated 42% of regional volume in 2025, but the incremental volume of the last three years came mainly from Chile, Colombia and Peru, which together account for 46% of shipments and for a larger share of the year-on-year increase. Third, price rather than volume explains the value curve. The average export value per set fell from USD 152 in 2020 to USD 146 in 2022 under currency and inventory pressure, then recovered to about USD 161 in 2026, which means gross value grew faster than unit volume in the recovery phase.
The practical recommendation is to sequence the region rather than treat it as one market: secure Chile, Colombia and Peru first because their trade and payment conditions are manageable; hold Brazil as a long-term position with strict payment control; and treat Argentina as a trial-order market only. The product that wins volume remains the 20–30 kg selectorised pair, shipped with Spanish documentation and K=K five-layer BC-flute cartons that survive both ocean freight and domestic parcel handling.
The main limitation of this report is measurement. National tariff schedules in the region do not separate adjustable from fixed dumbbells, so volumes are reconstructed from customs statistics, importer records and platform sell-through data rather than read directly from a single official series. Country shares are estimates, and the 2026 figure is an annualisation of first-half performance, not a recorded outcome. Directional conclusions are robust; individual percentages should be treated as ranges of roughly plus or minus three points.
Scope, Data and Method
The report covers Chinese-origin adjustable dumbbells, defined as units whose load is changed by a selector pin, dial or sliding collar, in the 5–60 kg range, sold as single units or pairs. Fixed dumbbells, barbell sets and plate-loaded racks are excluded, although customs classifications often combine them, which is the source of the measurement limitation noted above. Five markets are examined individually: Brazil, Chile, Colombia, Peru and Argentina; Ecuador and Uruguay appear only inside the residual category.
Three data families are used. Chinese customs export statistics provide the volume and value backbone; importer and bill-of-lading records identify the buyer types behind those shipments, distinguishing wholesale distributors from marketplace sellers; and platform-level sales data from Mercado Libre provides the retail signal that explains when restocking occurred. Figures for 2026 are annualised from first-half order flow and should be read as an estimate. All values are nominal US dollars.
The analytical approach is deliberately narrow. Rather than describing every line of the trade series, the report asks one question: where is the next unit of profitable volume, and what conditions determine whether a factory can capture it. Sections 3 to 5 establish what happened to volume, value and mix; sections 6 and 7 explain why, and what could reverse it; sections 8 and 9 translate that into a forward view and a set of operating choices.
Export Performance, 2020–2026
The region has completed a full cycle and re-entered growth
Shipments to South America followed a surge, correction and recovery sequence that is now complete. The 2020 jump of 89% and the further 23.2% in 2021 were driven by gym closures and by distributors building stock ahead of expected demand; by the second half of 2021 that stock was already excessive. The 2022 decline of 9.7% was therefore an inventory and currency event as much as a demand event: Brazilian importers cut orders as the real weakened and landed costs rose, and premium heavy models were the first to be cancelled. From 2023 the market re-based on smaller, more frequent orders, and volume has grown every year since, at 8.2%, 14.6% and 16.3% respectively.
The composition of that recovery matters more than its size. Early-cycle orders were full-container purchases from a small number of large wholesalers; current orders are smaller, more numerous, and increasingly placed by marketplace sellers who need mixed SKUs and retail-ready packaging. This lowers the entry barrier for mid-sized factories but raises the cost of serving the market, because fulfilment complexity replaces simple container economics.
Table 1 Export volume and value of adjustable dumbbells to South America, 2020–2026
|
Year |
Volume (sets) |
Value (USD 10,000) |
YoY volume |
Market conditions |
|
2020 |
142,000 |
2,160 |
+89.0% |
Gym closures; wholesalers in Brazil and Peru stock up; 24 kg and 32 kg pairs lead |
|
2021 |
175,000 |
2,640 |
+23.2% |
Peak year; platform sellers order heavily; excess inventory builds in h3 |
|
2022 |
158,000 |
2,310 |
-9.7% |
Currency depreciation and high inflation; order cuts and cancellations of heavy models |
|
2023 |
171,000 |
2,570 |
+8.2% |
Inventory cleared; small-batch, low-MOQ orders; 20–30 kg becomes mainstream |
|
2024 |
196,000 |
3,020 |
+14.6% |
E-commerce growth in Colombia and Chile; sports retail chains enter |
|
2025 |
228,000 |
3,640 |
+16.3% |
Home-gym demand consolidates; ODM orders and private labels expand |
|
2026E |
265,000 |
4,280 |
+16.2% |
Annualised from h2; influencer-led retail demand; tariff pressure on cost |
Data source: China customs export statistics, importer and bill-of-lading records, Mercado Libre sell-through data; 2026 annualised from first-half order flow. Volume includes adjustable units only; YoY calculated on unrounded values.
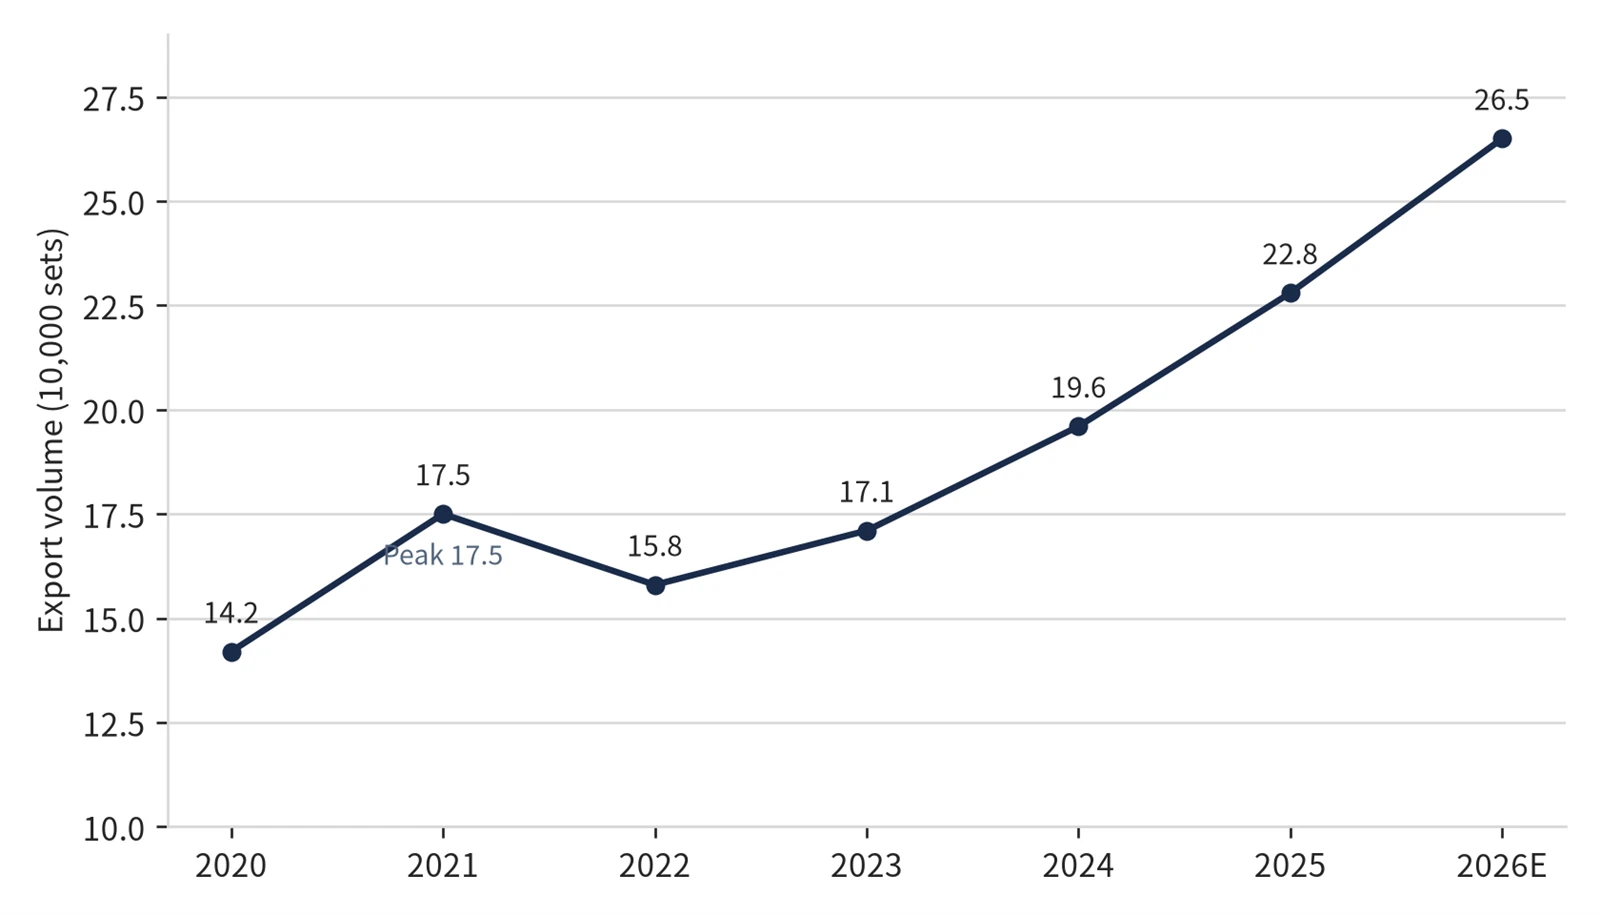
Figure 1 Export volume to South America, 2020–2026 (10,000 sets)
Data source: Table 1. 2026 is an estimate; the 2021 peak reflects distributor overstock that was reversed in 2022.
Figure 1 makes the shape of the cycle visible: the 2021 peak was not a demand ceiling but an inventory artefact, and the 2023 level was already above the pre-pandemic base. Read against that, the 2024–2026 slope is the more reliable indicator of underlying consumption, and it has been stable at 14–16% a year for three consecutive periods.
Value per set fell in 2022 and has recovered since
Average export value per set moved from USD 152 in 2020 to USD 151 in 2021, down to USD 146 in 2022, and then up to USD 150 in 2023, USD 154 in 2024, USD 160 in 2025 and about USD 162 in 2026. The 2022 dip is consistent with the mix shift that accompanied the downturn: buyers substituted cheaper entry models for cancelled heavy units and negotiated hard on price to offset currency losses. The recovery since 2023 is not evidence of consumers trading up. It reflects three cost pass-throughs: higher steel and freight costs, a richer mix of paired sets rather than single units, and the addition of retail packaging, Spanish manuals and private-label printing, all of which raise unit value without raising factory margin.
For planning, this means unit volume and revenue should be forecast separately. A 15% volume increase at a stable mix adds roughly 15% revenue; if the mix drifts back toward single entry-level units under tariff pressure, revenue growth can fall several points below volume growth even while shipments rise.
Country Structure: Brazil Sets the Ceiling, the Andes Set the Pace
Concentration in Brazil is high but no longer where growth comes from
Brazil accounted for an estimated 42% of regional volume in 2025, about 96,000 sets, and will remain the largest single market for the foreseeable future on population and home-fitness penetration alone. Its growth contribution, however, has flattened. High import duties, slow clearance and long foreign-exchange approval cycles raise the working capital a distributor must carry, which limits how fast order volumes can scale. The result is a market that grows with the category but does not lead it.
Chile, Colombia and Peru together took 46% of 2025 volume and supplied most of the year-on-year increase. Chile combines a stable trade environment with a mature e-commerce channel and the highest acceptance of mid-range product in the region; Colombia is the strongest Mercado Libre market and concentrates on 20–32 kg entry pairs; Peru is dominated by small and medium wholesalers who order in low MOQs and re-order frequently. Argentina remains constrained by exchange controls: orders are small, irregular, and best treated as trials rather than as a base load.
Table 2 Market shares and entry conditions by country, 2025
|
Country |
Share of volume |
Structural condition |
Implication for exporters |
|
Brazil |
42% |
Largest base; high duty, complex clearance, slow FX approval |
Long-term position; strict payment terms; consolidate shipments |
|
Chile |
18% |
Stable trade regime; mature e-commerce; mid-range acceptance |
Priority entry market; retail-ready packaging pays off |
|
Colombia |
16% |
Fastest platform growth; price-led demand |
Priority market for 20–32 kg entry pairs; platform sellers |
|
Peru |
12% |
Small and medium wholesalers; low MOQ, frequent re-order |
Flexible MOQ and mixed containers; short replenishment cycle |
|
Argentina |
7% |
Exchange controls; small, irregular orders |
Trial orders only; no speculative stocking |
|
Others |
5% |
Ecuador and Uruguay; parcel-level trade |
Opportunistic; no dedicated investment |
Data source: Table 1 volume base; importer records and platform sell-through used to allocate country shares. Shares are estimates and sum to 100%.

Figure 2 Distribution of 2025 export volume by destination country
Data source: Table 2. Shares are analyst estimates derived from importer and platform data, not from a single customs series.
Each market requires a different commercial entry point
The country differences are commercial rather than merely geographic. A Brazilian distributor evaluates a supplier on landed cost after duty and on the ability to hold stock through a long clearance cycle, which favours factories that can ship full containers of a narrow assortment and absorb longer payment terms. A Chilean or Colombian marketplace seller evaluates a supplier on reorder speed, carton durability for last-mile delivery, and whether the packaging can carry a local brand. A Peruvian wholesaler evaluates MOQ and price per set almost exclusively. Selling the same offer into all four produces the familiar outcome of losing Brazil on terms and losing the Andes on responsiveness.
Product Mix: the 20–30 kg Pair Is the Volume Base
The 20–30 kg adjustable pair is the product the region actually buys, and it will remain the base load through 2028. It accounts for roughly 65% of units, against 24% for the 40–52.5 kg band and 11% for 40 kg-plus or 90 lb-plus models. The reason is spatial rather than athletic: urban households in São Paulo, Bogotá or Santiago rarely have room for a rack of fixed dumbbells, so a single unit that replaces a set of eight earns its price on floor space alone. Heavy models remain a niche serving commercial gyms and serious home lifters, and they were the segment that collapsed first in 2022.
Mechanically, selector-pin and collar-lock designs outsell dial systems by a wide margin. Dial mechanisms command a higher retail price but add failure points under humid tropical conditions, which raises return rates for marketplace sellers; buyers consequently prefer simpler mechanisms with a demonstrable drop-test record. Rubber-coated, iron-sand-filled construction is the standard specification, and the three quality attributes that decide repeat orders are resistance to cracking after repeated drops from roughly 90 cm, absence of odour from the coating compound, and carton strength sufficient to survive parcel sorting.
Table 3 Product mix by weight band, 2025
|
Weight band |
Share of volume |
Typical use |
Buyer motive |
Commercial priority |
|
20–30 kg pair |
65% |
Home training in small apartments |
Replaces a rack of fixed dumbbells; space and cost |
Core offer; maintain stock continuity |
|
40–52.5 kg |
24% |
Semi-serious home lifters; small studios |
Higher load without a rack |
Second tier; bundle with stands |
|
40 kg+ / 90 lb+ |
11% |
Commercial gyms; specialist users |
High load; durability over price |
Selective; quote on request |
Data source: importer order records and platform SKU sell-through; shares are estimates for 2025 volume.
What Is Driving Demand
Home training in South America has become a persistent habit rather than a pandemic substitute. Gym reopening did not reverse the category, because the households that bought equipment in 2020 kept using it, and new buyers entered for a different reason: gym membership costs rose faster than incomes in several markets, making a one-off equipment purchase the cheaper path to regular training. This is the structural difference between the 2020 wave and the current expansion, and it is why the post-2023 growth has been steady rather than spiky.
Cross-border platforms have compressed the distribution chain, and that has changed who orders. When a marketplace seller in Colombia can list a product, sell it, and reorder within weeks, the intermediary layer that used to buffer demand disappears. Orders become smaller and more frequent, and factories that can support mixed containers and retail-ready cartons capture share that previously belonged to importers. The same dynamic explains the rise of private-label orders: a seller with a local brand needs a supplier that can print cartons and manuals in Spanish without a large minimum run.
Chinese supply capacity provides a durable cost advantage, but the advantage is narrowing at the low end. The domestic chain for iron-sand filling, rubber coating and carton production remains efficient enough to undercut European and North American brands by a wide margin at comparable quality. Vietnamese and Turkish suppliers, however, have entered the same entry-level segment, and the price gap to them is measured in single-digit percentages rather than in tens of percent. Differentiation therefore has to come from specification reliability, packaging and documentation rather than from price alone.
Retail presentation has become part of the product. In markets where most volume moves through marketplace listings, the carton, the Spanish manual and the product photography supplied to the seller determine conversion as much as the hardware does. Suppliers that deliver these as part of the order, rather than as a later favour, win repeat orders; those that treat packaging as an afterthought lose them to competitors whose hardware is no better.
Risks That Can Change the Trajectory
Tariffs are the largest single risk, and they are policy-driven rather than cyclical. Brazil's duty structure already inflates landed cost, and proposed increases on steel-bearing consumer goods in the region would compress the margin available to both importer and factory. Because adjustable dumbbells carry a high weight-to-value ratio, freight and duty together form a large share of landed cost, leaving little room to absorb an increase without either raising retail price or cutting specification.
Currency volatility transmits directly into order behaviour. When the real or the peso depreciates sharply, importers delay shipments, renegotiate prices and cancel heavy SKUs first. This is what produced the 2022 contraction, and the pattern will repeat in any future depreciation cycle regardless of underlying demand. Payment terms are the practical defence: letters of credit or a 30% advance reduce exposure, while long open-account terms convert a currency event into a credit loss.
Logistics and clearance add a second layer of cost uncertainty. Port congestion, inspection delays and destination surcharges lengthen the cash cycle, and the heavy, bulky nature of the product makes container utilisation sensitive to carton design. A carton that is 10% too large for the pallet plan costs more across the whole shipment than the packaging itself saves.
Competition is intensifying from two directions: low-cost suppliers from Vietnam and Turkey at the entry level, and local assembly or light manufacturing in Brazil and Colombia at the low end of the market. Neither displaces Chinese supply outright, but together they cap the price premium available for a product that is functionally similar.
Compliance failures can stop a shipment outright. Several markets require safety test documentation for consumer fitness equipment, and certification gaps lead to detention at the port rather than to a negotiated settlement. Test reports and certificates of origin should be prepared before the first order, not after the first delay.
Outlook for 2026–2028
The base case is continued growth at a moderating rate. Regional volume of about 265,000 sets in 2026 implies 300,000–315,000 sets in 2027, a 13–19% increase, and further growth in 2028, on the assumption that no major tariff increase takes effect and that currency conditions remain within recent ranges. Growth is expected to concentrate again in Chile, Colombia and Peru, with Brazil expanding at or slightly below the regional rate.
Two alternative scenarios bracket that base case. If a significant duty increase is applied in Brazil or Colombia alongside sustained currency weakness, volume growth could fall to mid-single digits in 2027 while value per set rises, as buyers substitute lighter and cheaper units. If trade conditions stay stable and platform penetration continues to rise, the upper end of the range is plausible, particularly if private-label programmes expand and commercial gym replacement demand returns.
Product direction is unlikely to change much within the forecast window. The 20–30 kg pair remains the volume base; the differentiation frontier lies in lighter shipping weight for the same nominal load, quieter operation, and packaging engineered for parcel networks rather than for pallet-only distribution. Smart or app-connected adjustable dumbbells address a very small share of regional demand and should not be treated as a volume strategy.
Recommendations for Exporters
Build the offer around the entry pair and its packaging
Concentrate production and stock on 20–30 kg selectorised pairs, since that band carries roughly two-thirds of regional volume and shows the most stable repeat-order pattern. Hold the 40–52.5 kg band as a second tier and quote heavier models on request rather than stocking them. Specify drop resistance to repeated falls from about 90 cm without cracking, odour-free coating, and cartons in K=K five-layer BC flute with a pallet plan that matches container limits; ship Spanish manuals and retail-ready artwork as standard rather than as an option, because they are what marketplace sellers need in order to list the product.
Sequence the markets and match payment terms to risk
Enter Chile, Colombia and Peru first, where clearance is predictable and orders can be served at low MOQ with short replenishment cycles. Treat Brazil as a strategic but slower position, served through consolidated full-container shipments with letters of credit or a 30% advance rather than open account. Restrict Argentina to trial quantities and require payment before shipment. In all markets, quote FOB as the base term and price the freight and duty separately so that the buyer sees the cost structure clearly when tariffs change.
Win channels through responsiveness rather than price
The channel that is growing is the marketplace seller and the small regional distributor, not the single large importer. Serving them means accepting mixed containers, holding stock for fast reorder, and supplying product imagery and Spanish copy that a seller can publish directly. Use customs and bill-of-lading data to identify buyers already shipping comparable products, and approach them with a specification and packaging proposal rather than a price list. Where a private-label programme is possible, offer carton and manual printing at a minimum run the seller can actually absorb.
Conclusion
South America is a growth market for adjustable dumbbells, but it is no longer an undifferentiated one. The cycle from 2020 to 2026 shows that demand survives the end of the pandemic shock, that value per set recovers only slowly, and that the incremental volume has moved from Brazil to the Andean markets. The 20–30 kg pair, shipped with credible drop performance, Spanish documentation and parcel-grade packaging, remains the product that carries volume.
The constraints are commercial rather than technical: duties, currency and clearance decide whether a shipment is profitable, and the answer differs by country. Sequencing the region, matching payment terms to risk, and competing on responsiveness and specification rather than on price is the approach most likely to convert the region's growth into a durable position.
Appendix A Data Notes and Calculation Basis
Volume series. The 2020–2025 values are compiled from Chinese customs export records for adjustable dumbbell classifications, cross-checked against importer and bill-of-lading records to remove fixed-dumbbell lines that share a tariff code. Where the two sources diverged by more than 10%, the customs figure was retained and the discrepancy noted. The 2026 value annualises first-half order flow without seasonal adjustment; regional demand is mildly weighted toward the second half because of year-end retail promotions, so the estimate may understate the final outcome by a small margin.
Growth rates. Compound annual growth of 11.0% is calculated as the sixth root of the ratio between 265,000 sets in 2026 and 142,000 sets in 2020. The post-trough rate of 15.7% is the third root of the ratio between 265,000 and 171,000 sets in 2023. Year-on-year percentages in Table 1 are computed on unrounded volumes, so they may differ slightly from percentages calculated from the rounded figures shown.
Value and unit price. Average export value per set is total value divided by total volume for each year, in nominal US dollars, and is not adjusted for inflation or exchange rate. Comparisons across years therefore reflect both mix and price movement, and should not be read as a pure price index.
Country shares. Shares in Table 2 and Figure 2 are estimates allocated from importer records and platform sell-through data. They are rounded to whole percentages and sum to 100%. The residual category covers Ecuador, Uruguay and parcel-level trade that cannot be attributed to a single destination with confidence.
Product shares. Weight-band shares in Table 3 are estimates based on order records and SKU-level sell-through, and refer to 2025 volume. They describe the composition of exports, not of retail sales, and may differ from consumer-facing category data.