Executive Summary
China's disposable paper plate exports to South America grew at an estimated compound rate of about 12% a year between 2020 and 2026, with physical volume rising from an index of 100 to roughly 197. The path was not linear. 2021 added about 39% and 2022 about 19%; from 2023 the region settled into annual growth of 4–5%. The central judgement of this report is that South America has moved from a volume-expansion market into a share-shift market. Growth after 2022 came almost entirely from biodegradable bagasse plates, whose share of volume rose from about 6% in 2020 to an estimated 44% in 2026, while conventional coated plates peaked at an index of 124 in 2022 and have since drifted down to about 110.
The country structure explains most of the margin difference. Brazil remains the largest single destination at an estimated 38% of 2026 volume, but it is also the market where local bagasse converting capacity, MERCOSUR tariff protection and currency volatility compress price and payment terms most severely. Incremental volume has concentrated in the free-trade-agreement partners - Chile, Peru and Ecuador - where certificate-of-origin tariff elimination, stricter enforcement of single-use plastic bans and shorter west-coast transit times have lowered landed cost and made Chinese supply the default replacement source.
Three actions follow from this reading. Volume allocation for 2027 should shift toward the FTA partners rather than toward Brazil. The product portfolio should treat conventional white plates as a capacity-filling commodity and heavy-duty biodegradable plates as the growth and margin carrier. Compliance preparation - food-contact test reports and compostability documentation recognised in the destination market - should be completed before it becomes a shipment-level risk rather than after an order is lost. The main limitation of this analysis is the data: South American customs do not report paper plates under a dedicated statistical line, so every figure below is an estimate indexed to 2020, not a measured tonnage.
Scope, Method and Data Basis
Product scope
The analysis covers two product families exported from China: conventional coated paper plates, meaning clay-coated or film-coated white plates in the 15–23 cm range used for general catering and household use; and biodegradable plant-fibre plates, predominantly bagasse (sugarcane pulp) moulded plates, including heavy-duty and oil-resistant variants. Printed party and seasonal plates are treated as a sub-category of both families because they share the same production lines but carry different margins and different compliance exposure. Paper cups, paper bowls, moulded-fibre trays and napkins are excluded even though they are often shipped in the same container, because their demand drivers and competitive sets differ. South America is taken as the twelve countries of the region, with Brazil, Chile, Peru, Argentina, Colombia, Ecuador and Uruguay analysed individually.
Data basis and estimation approach
Paper plates do not have a dedicated customs line. They sit inside HS 4823.69 together with cups, bowls and trays, and importers rarely declare them separately at the ten-digit level. Absolute tonnage by country therefore cannot be observed directly, and any report that presents a precise tonnage figure for this category is working from a private estimate rather than a published statistic.
Volume in this report is built from three inputs: Chinese export statistics for HS 4823.69 to the region; importer-side shipment records for Brazil and Chile, which give shipment counts and consignee concentration; and order and shipment data from exporting manufacturers for the 2024–2026 period. The three inputs are reconciled into a single index with 2020 set at 100, and all comparisons are made in index points and shares rather than in tonnes. Growth rates are rounded, and a difference of one or two percentage points between two estimates should be read as estimation noise rather than as a real change.
Two further conventions apply. First, the index measures physical volume, not value. Unit value for conventional plates fell through 2023–2025 as base paper prices eased and price competition intensified, so export value grew more slowly than volume in that segment; this is stated explicitly wherever it affects the conclusion. Second, 2025 is based on nine months of actual data plus an estimate for the fourth quarter, and 2026 combines confirmed order books through the third quarter with a scenario for the fourth. Both years are therefore forecasts at the margin and should be revised once full-year data is available.
Volume Trajectory, 2020–2026
The cycle in one view: total volume nearly doubled, but the two product families diverged after 2022
Figure 1 shows the total index and its two components. Total volume rose from 100 in 2020 to about 197 in 2026, but the composition changed fundamentally. Conventional plates climbed to 124 in 2022 and then declined to about 110, while biodegradable plates rose from 6 to about 87, a fourteen-fold increase from a very small base. The divergence is the single most important fact in this report: after 2022, the region's total growth was supplied almost entirely by substrate substitution, not by growth in underlying demand for paper plates as such.
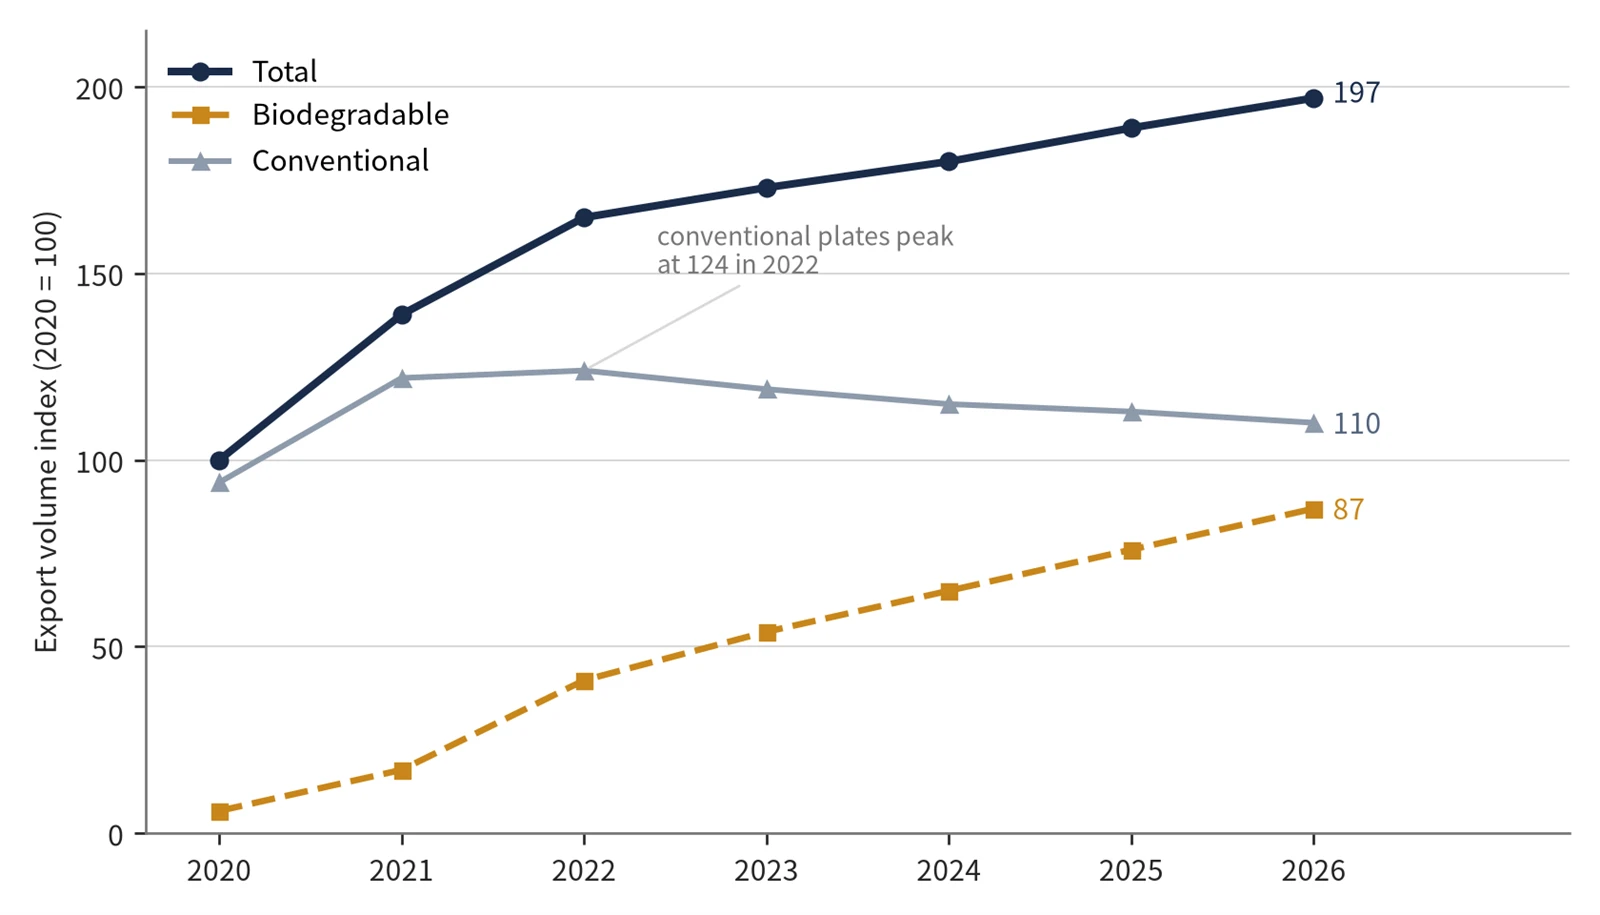
Figure 1 Export volume index of Chinese disposable paper plates to South America by product family, 2020–2026 (2020 = 100)
Data source: author's estimates from China customs HS 4823.69 export statistics, importer shipment records for Brazil and Chile and exporter order data; 2025 and 2026 partly forecast. Index measures physical volume, not value.
The mix shift in Figure 2 is the mechanism behind that divergence. Biodegradable plates moved from about 6% of volume in 2020 to 25% in 2022 and an estimated 44% in 2026. Read together, the two figures say something specific about the competitive situation: total demand kept growing at 4–5% a year, but the conventional segment stopped growing because each additional unit of biodegradable demand displaced a conventional unit rather than adding to the market.
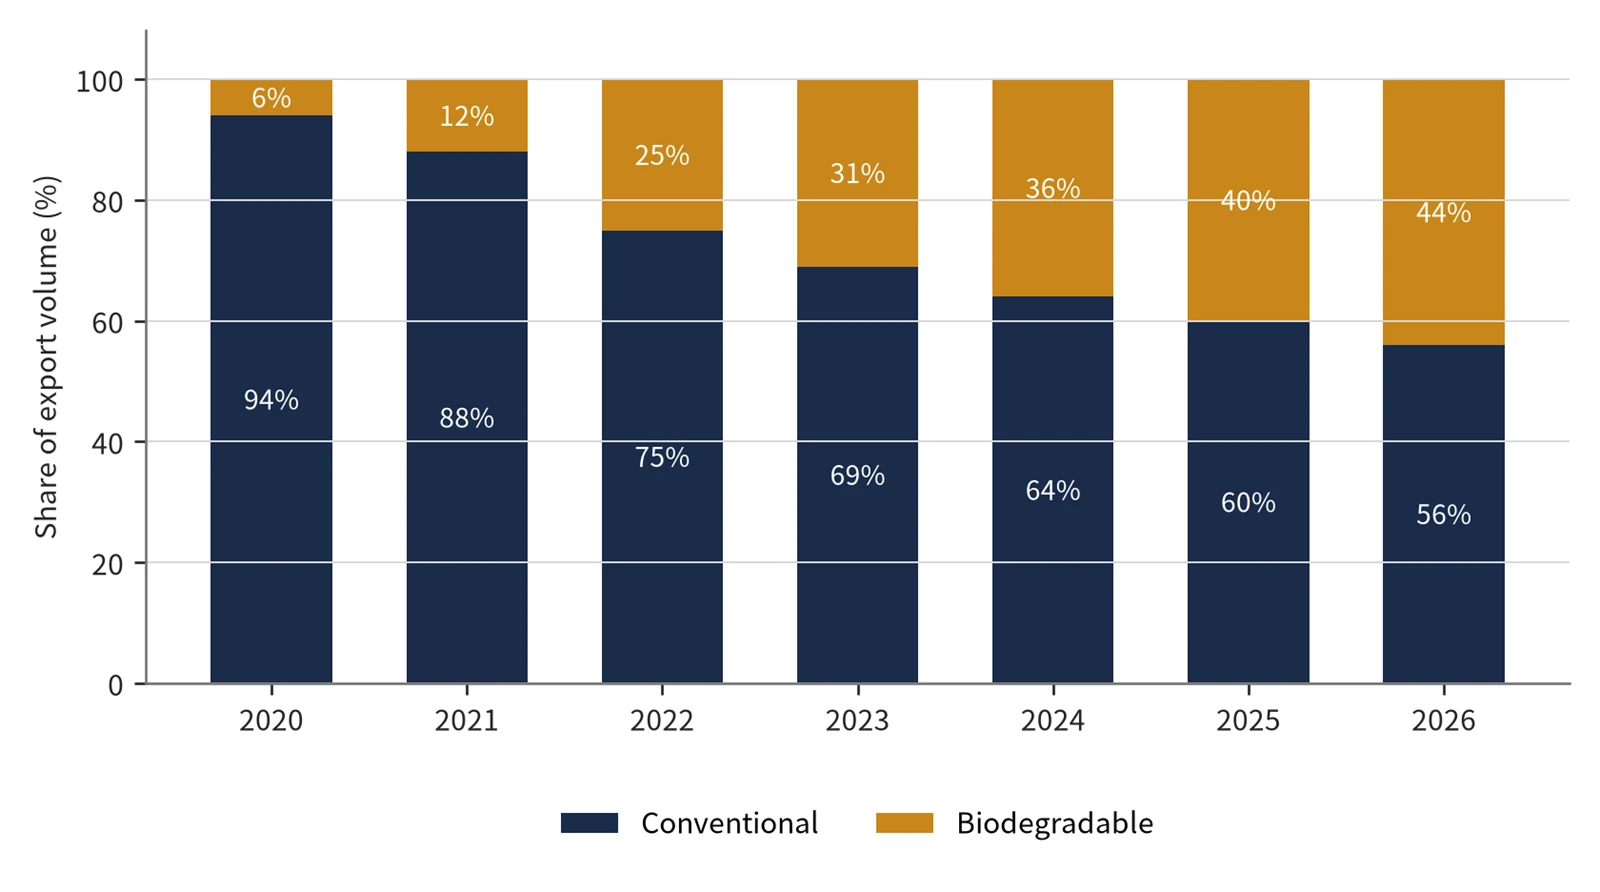
Figure 2 Product mix of Chinese paper plate exports to South America, 2020–2026 (% of physical volume)
Data source: author's estimates based on the same inputs as Figure 1; shares rounded to the nearest percentage point.
2020: a pandemic-driven pulse that set an unusually low baseline
2020 was not a normal year and should not be used as a stable reference point. Lockdowns shifted household food consumption to the home, delivery orders rose sharply, and hygiene concerns made single-use tableware more acceptable in channels that had previously used washable service. At the same time, imported plastic tableware was disrupted, and buyers who could not obtain plastic moved to paper. The result was a demand pulse concentrated in basic white plates, large-count packs and low unit prices, with Brazil the dominant destination because of its size and the depth of its supermarket and street-food channels.
The operational memory of that year matters for planning. Port congestion and container shortages pushed transit times from roughly 35–45 days to 70 days or more on some rotations, demurrage and detention charges were absorbed by suppliers in many contracts, and freight cost per container rose several fold. Several importers responded by splitting orders into smaller lots, a behaviour that persisted after freight normalised and which still shapes order patterns in the region.
2021–2022: the fastest growth, driven by regulation rather than by demand
The 2021–2022 expansion was policy-led. Chile's single-use plastics law, approved in August 2021, barred food outlets from providing plastic cutlery, stirrers, straws and polystyrene articles from February 2022, and similar restrictions were introduced at national or municipal level in Peru and in several Brazilian states and municipalities. Procurement specifications at supermarket chains and food-service groups changed before the compliance deadlines, which pulled forward orders. This is why 2021 grew about 39% while regional GDP growth was recovering only modestly from the pandemic: the growth came from substitution, not from consumption.
Growth was uneven by destination. Chile and Peru recorded faster import growth than Brazil in this phase, helped by the tariff preference available under the free-trade agreements in force since 2006 and 2010 respectively, and by the fact that neither country had enough domestic converting capacity to absorb the switch. Brazil grew too, but from a larger base and against earlier local production of coated plates.
Product mix changed at the same time. Party and printed plates, which had been a marginal category, became a meaningful order line as birthdays, school events and football-season gatherings resumed, and buyers wanted visual differentiation rather than the cheapest white plate. The segment carries higher unit value and shorter order cycles, but it also introduces design and intellectual-property risk, discussed in section 6.
2023–2024: deceleration caused by four pressures acting together
Growth fell to about 5% in 2023 and 4% in 2024, and the composition of that residual growth was almost entirely biodegradable. Four pressures explain the deceleration, and they should be treated as structural rather than cyclical.
Local capacity substitution came first. Brazil's sugar-ethanol clusters in São Paulo state gave rise to bagasse moulding plants integrated with mills, with lower feedstock cost and domestic freight measured in hundreds rather than thousands of kilometres. These plants are competitive in the plain, mid-weight segment and take exactly the orders that Chinese suppliers used to win on price alone.
Purchasing power came second. Inflation and currency depreciation in Argentina and Brazil compressed importer budgets, and buyers responded by reducing order size, extending payment terms and switching to lower grammage. Order fragmentation raised the administrative cost per container for suppliers even where unit price held.
Compliance came third. Food-contact requirements for paper articles were tightened and enforcement of labelling and migration limits became more consistent at entry. Suppliers without test reports covering heavy metals, fluorescent whitening agents and migration into fatty foods began to lose orders or to absorb re-testing costs at short notice.
Price deflation came fourth. As base paper prices eased from their 2021–2022 peak, conventional plate prices fell. Volume therefore held up better than value, and suppliers who measure performance in US dollars saw a weaker picture than the physical index suggests. Conventional plate buyers also became more price-sensitive precisely because the product had become commoditised.
2025–2026: growth returns, but it is concentrated and FTA-weighted
The 2025–2026 recovery to about 5% and then 4% is not a return to the 2021 pattern. It is narrower. Two changes support it. The deep-water port at Chancay in Peru, which began operating at the end of 2024, shortened direct Asia–Peru transit time and reduced landed cost for the Peruvian and, indirectly, the Chilean and Ecuadorian markets. And importers in the FTA countries became more systematic in using certificates of origin, which removes or reduces duty on a product where duty is a visible share of landed cost.
The pattern within the region differs by country. Peru, Chile and Colombia are the incremental contributors in 2025–2026, each growing in the high single digits on a small base. Brazil remains the largest market but is close to flat in volume and negative in unit value, because local supply covers the low end and price competition among Chinese suppliers is intense at the entry level. Argentina is volatile: order intake swings with import regime changes rather than with end demand.
Country Structure: Size, Growth and Margin Do Not Coincide
The most consequential misreading of this market is to treat size as opportunity. Brazil is the largest destination and simultaneously the lowest-margin one; Chile and Peru are mid-sized and carry the best incremental economics. Table 1 summarises the position by country.
Table 1 Country position in China's paper plate exports to South America, 2026 estimate
|
Country |
Share of 2026 volume |
Volume trend 2024–2026 |
Tariff position |
Principal constraint |
Priority product |
|
Brazil |
38% |
Flat to +2% a year |
MERCOSUR common external tariff |
Local bagasse capacity; BRL volatility; price war |
Heavy-duty biodegradable; private label |
|
Chile |
14% |
+8–12% a year |
FTA preference since 2006 |
Strict specification; small order lots |
Certified compostable; printed party |
|
Peru |
13% |
+10–14% a year |
FTA preference since 2010 |
Thin importer credit; port concentration |
Biodegradable; catering packs |
|
Argentina |
12% |
Volatile, ±15% |
Preferential but regime-dependent |
FX controls; import licensing; payment risk |
Verified clients only; LC terms |
|
Colombia |
8% |
+6–9% a year |
MFN, no preference |
Duty cost; fragmented channel |
Printed party; medium-weight plates |
|
Ecuador |
5% |
+9–12% a year |
Agreement implemented 2024 |
Small base; border logistics |
Biodegradable; supermarket packs |
|
Uruguay |
4% |
+4–6% a year |
MERCOSUR external tariff |
Very small volume; re-export overlap |
Party and seasonal programs |
|
Others |
6% |
+3–5% a year |
Mixed |
Fragmented, low visibility |
Opportunistic |
Data source: author's estimates from the inputs described in section 2.2; tariff position reflects the agreements in force at the data cut-off and does not constitute customs advice.
Brazil: the largest market is the weakest margin market
Brazil accounts for roughly 38% of regional volume because of population size, a deep supermarket sector and a strong culture of parties, football gatherings and street food. It is also the market where Chinese suppliers face the strongest combination of local substitution, tariff and currency pressure. Domestic bagasse moulding capacity sits next to the raw material, which removes the ocean freight and duty that a Chinese container carries. The common external tariff adds cost at entry, and BRL movement changes the landed cost of a dollar-priced container within a single order cycle.
The practical implication is not to exit Brazil but to stop competing there at the bottom of the range. Large chains and food-service groups buy on specification, certification and service level as well as price, and these are areas where a Chinese supplier with a certified heavy-duty range and reliable private-label printing can still win. Competing for the lowest-price plain plate in the wholesale channel, against a domestic producer whose raw material is next door, is a losing position over a multi-year horizon.
Chile and Peru: the best incremental economics in the region
Chile and Peru together represent about 27% of volume but a disproportionate share of incremental volume in 2024–2026. Both have enforced plastic restrictions with visible compliance dates, both depend on imports for a large part of their paper tableware, and both offer tariff preference under agreements in force since 2006 and 2010. Chile additionally has a specification-driven modern trade sector: once a retail chain or food-service group writes a compostability requirement into its purchasing standard, the order moves to whichever supplier can document compliance, and price becomes secondary.
Peru has the advantage of the shortest transit and the most direct shipping link with Asia after the opening of Chancay, and the disadvantage of a thinner importer base with limited access to bank credit. The commercially useful structure there is to work through a small number of established importers with confirmed credit lines rather than to chase volume through new accounts.
Argentina: demand is not the constraint, payment is
Argentina holds about 12% of regional volume and steady end demand, but order intake moves with the import regime rather than with consumption. Foreign-exchange controls, licensing requirements and frequent changes in the rules for advance payment mean that a confirmed order can be delayed or repriced after production has started. The appropriate posture is selective: keep long-standing accounts with verified payment history, price in short validity windows, require advance payment or a confirmed letter of credit, and avoid building capacity commitments on Argentine order books.
4.4 Colombia, Ecuador and Uruguay: small, stable and useful for differentiated lines
The three together account for about 17% of volume. None is large enough to anchor a capacity decision, but each is useful for a specific purpose. Colombia has no tariff preference, so it rewards products with higher unit value where duty is a smaller proportion of the retail price - printed party plates and medium-weight catering plates. Ecuador's agreement with China, implemented in 2024, improves the economics of biodegradable lines on a small base. Uruguay is small, but its proximity to the Brazilian border means part of its import volume overlaps with Brazilian distribution, so order patterns can shift with Brazilian pricing.
Drivers and Constraints
Regulation is the primary demand driver, and its effect is already largely priced in
The substitution from plastic to paper in South America is a regulatory event, not a consumer preference shift. Chile's framework is the clearest example: the law approved in 2021 removed plastic cutlery, stirrers, straws and polystyrene articles from food outlets from February 2022, and extended obligations to other channels in stages. Comparable restrictions exist in Peru and in Brazilian states and municipalities, with different scope and different enforcement intensity.
The consequence for planning is that the first, largest wave of substitution has already happened. The remaining growth from regulation is incremental: channels that were exempt in the first phase, smaller municipalities, and specifications that move from 'no plastic' to 'certified compostable'. A supplier planning 2027 on the assumption of another 2021-style regulatory surge will over-commit capacity.
Cost position comes from scale, customisation and origin status, not from cheap paper
Chinese supply competes in this region on three things that local producers find hard to match: the breadth of the range available from one supplier, the ability to print and pack to a private-label specification at moderate volumes, and the flexibility to consolidate several paper categories in a single container. Base paper cost is no longer a decisive advantage, because Brazilian producers buy bagasse locally and global pulp and paper prices have been broadly similar across regions since 2023.
Origin status is an under-used advantage. Under the FTA agreements, a certificate of origin converts a visible duty line into margin, and it also allows a supplier to price at or slightly below a domestic competitor without giving up margin. Where importers handle this paperwork themselves the benefit is captured by them; where the supplier manages it, it becomes a negotiating asset.
The constraints that will bind through 2027
Local capacity in Brazil will keep expanding in the plain mid-weight segment and will keep taking share at the entry level. Currency and payment risk in Argentina and Brazil will keep order books unstable. Compliance requirements will keep rising in specificity, from food-contact safety toward documented compostability and recyclability claims, and the cost of meeting them falls on the supplier before the order is confirmed. Logistics will remain less predictable than on the North Atlantic or Trans-Pacific routes: port congestion, customs inspection and demurrage are recurring costs that need to be priced into quotations rather than absorbed.
One additional risk deserves explicit monitoring. If trade barriers in North America divert Chinese paper tableware capacity into Latin America, price competition in the conventional segment will intensify beyond what local capacity alone would produce. That scenario would compress margins in Brazil and Colombia first, because those are the markets where conventional plates dominate and where buyers switch suppliers on price.
Product Mix: Where the Margin Actually Sits
The three product tiers behave like different businesses even though they come off the same line. Conventional white plates in the 17–23 cm range are a commodity: buyers compare landed cost per thousand units, order sizes are large, specifications are stable and switching costs are low. Gross margin is thin and volatility comes from paper price and freight rather than from the customer relationship.
Heavy-duty biodegradable plates carry a specification premium of roughly 8–15% over conventional equivalents at comparable weight, and the premium is defensible because the buyer cannot easily switch: the plate has been written into a purchasing standard, a certification has been accepted, and a change of supplier requires re-approval. This is the tier where a documented compliance file functions as a commercial moat rather than as a cost.
Printed party and seasonal plates carry the highest unit margin and the shortest order cycles, with demand concentrated around football seasons, holidays and school calendars. The commercial risk here is not price but intellectual property: unlicensed use of film, cartoon or sports-team artwork invites seizure at entry and exposes the importer to claims. Artwork should be either original, licensed, or clearly generic, and the indemnity position should be stated in the supply contract rather than assumed.
The mix conclusion is straightforward. A supplier that treats all three tiers as 'paper plates' and prices them from a single cost sheet will lose money in the conventional tier and leave money on the table in the other two. Costing, quotation validity and compliance documentation should be managed separately by tier.
Competitive Landscape
Chinese exporters remain the largest external source but are fragmented, with many mills competing for the same importer relationships in Brazil and the same specification-driven accounts in Chile. Fragmentation hurts most in the conventional tier, where several suppliers quote nearly identical products to the same buyer and the buyer arbitrages between them on price and payment terms.
Brazilian producers are the strongest local competitors and are concentrated where their raw material advantage is greatest: bagasse moulding integrated with sugar and ethanol operations. Their weakness is range breadth, print capability and export-grade certification, which is why the mid-weight plain segment is contested and the certified heavy-duty and printed segments are not.
Southeast Asian suppliers, principally Vietnam and Thailand, compete in the low-price conventional segment and take share where buyers are price-led and certification requirements are light. They are less relevant in the certified biodegradable segment and in private-label programs that need multi-category consolidation.
Implications and Recommended Actions for 2027 Planning
Reallocate volume toward the FTA partners without abandoning Brazil
The recommended allocation is to place new capacity commitments and new customer development in Chile, Peru and Ecuador, where tariff preference and transit improvement support both volume and margin, and to hold Brazil at its current share rather than growing it. A workable 2027 target is to lift the three FTA markets from about 32% to 38–40% of volume while keeping Brazil near 36–38% and treating Argentina as an opportunistic market capped by payment capacity.
Manage three product tiers as three separate businesses
Conventional plates should be costed on a pass-through basis with short quotation validity, used to fill capacity, and defended only where a buyer values service and consolidation over unit price. Biodegradable heavy-duty plates should be positioned as the growth line, priced on specification value rather than on weight, and supported by a standard compliance pack that can be sent to a new buyer within days. Printed party lines should be sold as programs with artwork management, minimum print runs and seasonal planning rather than as catalogue items.
Close the compliance gap before it appears in a purchase order
The binding constraint through 2027 is documentation, not capacity. A supplier entering a specification-driven account in Chile or Peru should already hold food-contact test reports covering heavy metals, fluorescent whitening agents and migration into fatty and aqueous foods, together with compostability documentation acceptable to the destination authority, and Spanish-language labelling artwork that matches the declared material. The cost of assembling this file once, in advance, is far below the cost of losing a confirmed order or absorbing a re-inspection at port.
Commercial terms and risk control by market type
Payment terms should be set by market type rather than by customer size. In Chile, Peru and Ecuador, a 30% deposit with the balance against a copy of the bill of lading is workable for established importers, with credit insurance considered above a defined exposure. In Argentina, advance payment or a confirmed letter of credit should be the default, with quotations carrying short validity and a currency clause. In Brazil, freight and duty should be quoted as a landed-cost calculation rather than as a bare FOB price, because the buyer's decision is made on landed cost and a supplier who cannot show it loses the comparison.
Signals that would change this assessment
Four signals should be monitored, and any one of them would justify revisiting the allocation above. First, commissioning dates for new Brazilian bagasse converting capacity, because each new line removes a block of conventional demand. Second, BRL and ARS movements against the dollar, because a sustained depreciation shifts buyers toward lower grammage and shorter payment terms. Third, changes in food-contact or labelling requirements at MERCOSUR level, because these raise the fixed cost of serving the region. Fourth, the scale of Chinese capacity diversion into Latin America caused by North American trade barriers, because that would compress conventional margins faster than local competition alone.
Conclusion and Limitations
Between 2020 and 2026, China's disposable paper plate exports to South America roughly doubled in volume, but the growth was front-loaded and then changed character. The 2021–2022 surge came from a one-off regulatory substitution; the 2023–2026 phase has been a share shift between product families rather than an expansion of the market. Conventional plates have plateaued and are slowly declining, biodegradable plates have become the growth carrier, and the incremental economics have moved from the largest market to the FTA partners.
The implication for planning is that country selection, product tier and compliance readiness now matter more than price. Suppliers who continue to plan on regional volume growth, and who treat Brazil as the anchor market for conventional plates, will find themselves defending a shrinking segment against a local competitor with a structural cost advantage. Suppliers who move volume toward Chile, Peru and Ecuador, hold a certified biodegradable range, and can document compliance before it is requested are positioned to capture the growth that remains.
Two limitations should be kept in view. The volume figures are estimates built on partial customs data and are expressed as an index rather than as tonnage, so they support directional and comparative conclusions but not contract-level commitments. And the 2026 figure includes an estimated fourth quarter; it should be revised once full-year data is available, particularly for Brazil, where the conventional segment is most sensitive to price competition.
Appendix A Sources and Method Notes
A.1 Estimation chain. HS 4823.69 export records provide value, weight and destination at the six-digit level. Because cups, bowls and trays are aggregated with plates, the plate share is estimated from product-mix data supplied by exporting manufacturers and cross-checked against importer shipment records, which list consignee and product description. The resulting volume series is converted to an index with 2020 = 100 so that absolute tonnage is not implied.
A.2 Sources consulted.
Gobierno de Chile, Ministry of Environment. Single-use plastics law: restrictions on cutlery, stirrers, straws and polystyrene articles from February 2022. https://www.gob.cl/en/news/local-supermarkets-and-convenience-stores-must-sell-beverages-in-returnable-packaging-from-august-13/ (accessed 9 November 2026).
UNCTAD, submission by ALADI on sustainable alternatives to single-use plastics and plastic packaging in international trade, 2022. https://unctad.org/system/files/non-official-document/ditc-ted-06122022-plasticsWTO-Anexo_321-22.pdf (accessed 9 November 2026).
Volza, Paper Tableware Imports in Brazil: shipment counts, importer and supplier concentration, 2025. https://www.volza.com/p/paper-tableware/import/import-in-brazil/ (accessed 9 November 2026).
Exporter order and shipment data for 2024–2026, supplied by manufacturing partners and treated as commercial-in-confidence; used only in aggregated index form.
A.3 Limitations. No South American customs authority publishes a dedicated statistical line for paper plates. Index levels, growth rates and shares in this report are therefore analytical estimates, not measured statistics, and should be used for planning direction rather than for contract commitments. Tariff and origin statements describe the position at the data cut-off and do not constitute customs or legal advice.